
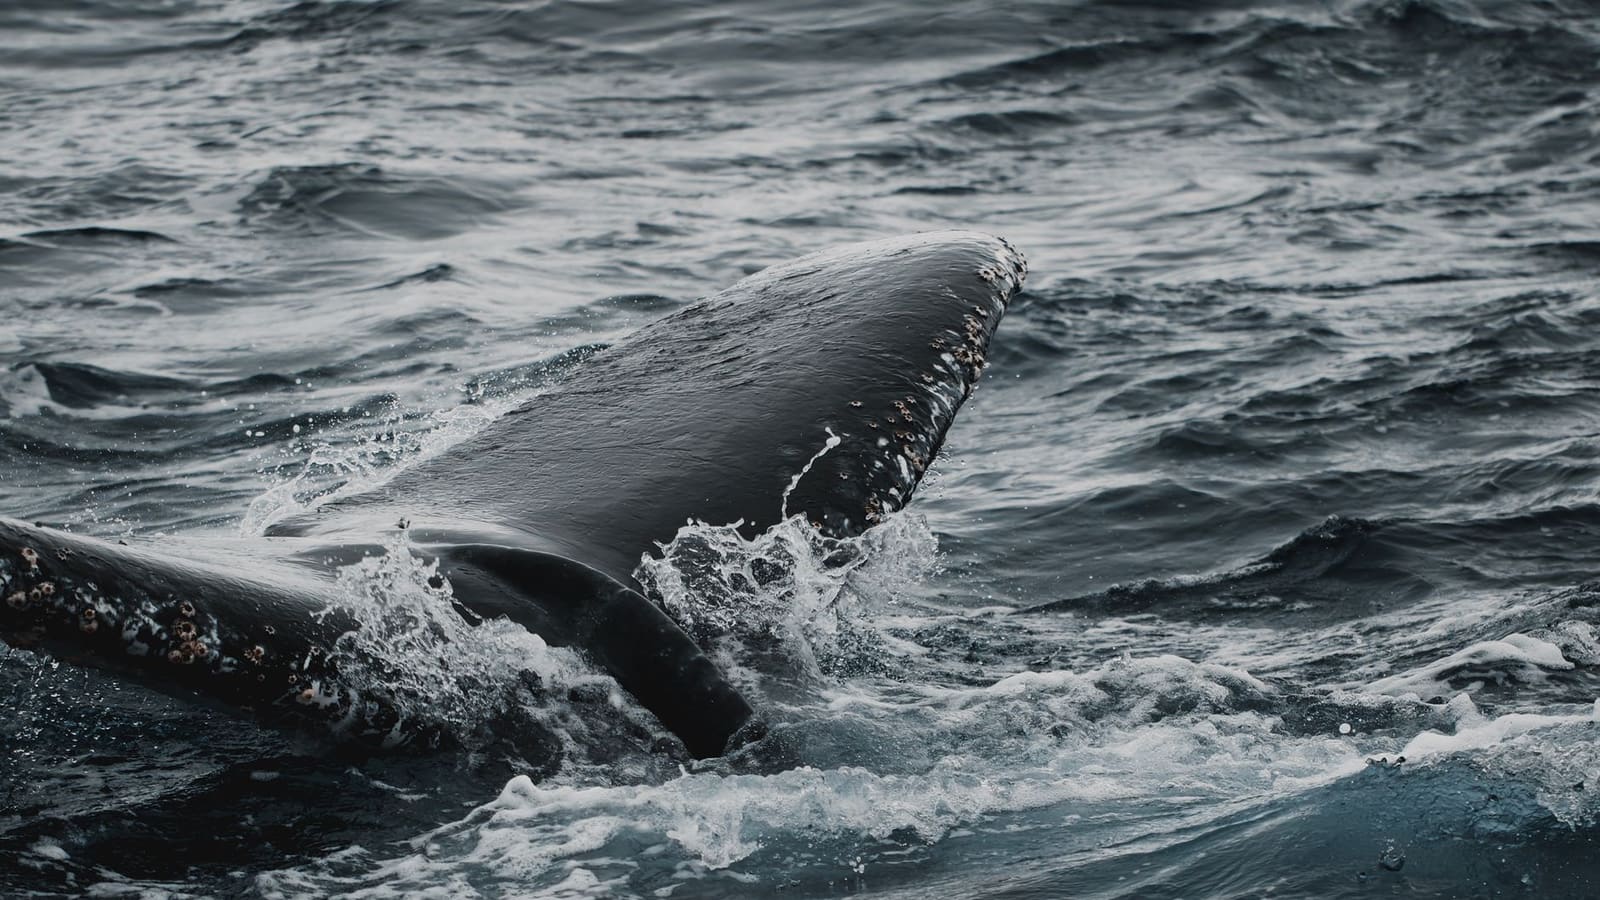
There is a plug of earwax sitting in a museum drawer in Washington State that knows what the ocean sounded like in 1972. It is six inches long, looks like a battered candle, and was coughed up by a bowhead whale sometime before the creature was harvested by Indigenous hunters off the Alaskan coast. For decades, nobody thought much of it. Then a marine biologist named Stephen Trumble realized that whale earwax—unlike almost anything else in the biological world—lays down growth rings, year after year, trapping a chemical diary of everything the animal encountered. Hormones. Pollutants. Ocean temperatures. Stress levels during whaling season.
It is, in essence, a climate archive that swims.
We are used to thinking of climate data as something pulled from Antarctic ice cores or bristlecone pine rings—noble, mineral, ancient. But as climate modeling grows more precise, the gaps in those records have become impossible to ignore. Ice cores tell us about atmospheric carbon. Tree rings tell us about rainfall. But what about sea surface temperatures in the South Atlantic in 1840? What about Arctic ice extent before satellite imaging? What about the chemical composition of the ocean before industrial fishing?
To answer those questions, scientists have started raiding places nobody thought to look. The result is a strange, almost literary enterprise: reconstructing the planet’s environmental memory from objects that were never meant to be records at all.
The Whale Earplug Library
Baleen whales produce earwax continuously throughout their lives. Unlike human earwax, which drains, whale earwax has nowhere to go. It builds up in the ear canal, hardening into layered plugs that can exceed a foot in length. Each layer corresponds to roughly six months of feeding and migration.
Trumble and his colleagues at Baylor University were the first to systematically section these plugs and read them like sediment cores. What they found was staggering. A single earplug can contain a lifetime of data—stress hormones spiking during mating seasons, spikes of cortisol correlated with whaling activity in the mid-20th century, traces of DDT and PCBs that map perfectly onto the historical timeline of industrial chemical use.
One plug from a male blue whale, harvested in 1965, contained a record spanning roughly seven decades. It showed mercury exposure rising through the 1940s, plateauing during wartime industrial lulls, then climbing again. It is the only biological archive we have that can track an individual animal’s lifetime exposure to ocean contaminants, layered against shifting ocean chemistry.
There are now hundreds of these plugs in museum collections, many of them gathered from Indigenous subsistence hunts in Alaska and Canada. They sit alongside jars of barnacles, baleen plates, and preserved stomach contents—an accidental library waiting for the right questions.
Old Ship Logs as Oceanographic Instruments
If whale earwax gives us the deep ocean, old ship logs give us its surface—and in astonishing detail.
Starting in the 1850s, the British Royal Navy required every vessel to record sea surface temperature, wind direction, cloud cover, and sea state at set intervals during a voyage. The Americans followed suit. The result is millions of handwritten entries, logged by junior officers in conditions that ranged from monotonous to mutinous, covering nearly every ocean basin on Earth.
For most of the 20th century, these logs sat in archives—Kew, the National Maritime Museum in Greenwich, the U.S. National Archives—dusty and unread. Then a project called Old Weather, launched in 2010 by the National Oceanic and Atmospheric Administration and the Zooniverse citizen science platform, began crowdsourcing their transcription. Volunteers digitized thousands of logbooks from Arctic patrol vessels, whaling ships, and Royal Navy cruisers.
The data was revelatory. Sea ice extent in the Arctic during the early 20th century turned out to be significantly more variable than ice cores and sediment records suggested. Naval logs from the 1920s described open water in passages that satellite records would later show as frozen solid. This matters enormously for calibration: if climate models assume a static pre-industrial baseline, they will miscalculate the rate of change.
The logs also captured weather extremes that no other record documents. A Royal Navy vessel caught in a cyclone off Madagascar in 1883 logged pressure drops and wind shifts that, when fed into modern reanalysis systems, revealed storm patterns consistent with El Niño conditions previously thought to be absent from the Indian Ocean that year.
Vintage Wine as a Carbon Time Machine
Perhaps the strangest archive of all is sitting in wine cellars across Europe.
Grapevines are notoriously sensitive to climate. The timing of harvest—when grapes reach sufficient sugar concentration to be picked—has been recorded in European parish registers, municipal archives, and wine merchants’ ledgers going back to 1354 in Burgundy. That is 670 years of continuous phenological data, collected by monks and vintners who had no idea they were building a climate record.
A team led by the French climate scientist Elisabeth Duchêne cross-referenced these harvest dates with modern temperature data and found a near-perfect correlation. Hotter years mean earlier harvests. The record is so precise that it can reconstruct summer temperatures in central France to within half a degree Celsius, centuries before thermometers existed.
What the wine record shows is sobering. The period from 2003 to 2023 includes five of the earliest harvests in the entire 670-year record. The 2003 harvest, during the European heat wave that killed an estimated 70,000 people, was the earliest since 1893—until 2018 broke that record, and 2022 broke it again.
But the record also captures surprises. The 17th century, long considered the nadir of the Little Ice Age, shows extreme year-to-year variability rather than uniformly cold summers. Some years—1647, 1675—saw harvests earlier than the 20th-century average. This complicates the picture of a simple, steady cooling trend and suggests that the climate system’s internal variability may be larger than we assume.
The Pattern Beneath the Bizarre
What unites these archives is not just their strangeness. It is their specificity. Ice cores average across decades and continents. Tree rings blur regional variation. But a whale earplug is an individual animal’s life. A ship log is a single vessel on a specific Tuesday. A wine harvest date is one vineyard, one valley, one growing season.
That granularity is what climate models need now. The broad strokes are settled. What remains uncertain is how climate change manifests locally—whether a given coastline will see wetter monsoons or drier ones, whether a fishery will collapse or migrate. Answering those questions requires data from places and times that instruments never reached.
The past, it turns out, was recording itself all along. It just needed someone eccentric enough to read it in candle-shaped earwax, cramped naval handwriting, and the sugar content of a Pinot Noir harvested in 1647.